Browse By Fluorochrome
Compare filter sets by selecting the recommended/alternative set listed for each fluorochrome below.
- If you need more information, please click fluorochrome. You can see each fluorochrome information and recommended filter sets.
- If you need other dye information, please contact us.
- Tel : 02-3473-4188~9
- E-mail : jhjin@jnoptic.com
하단의 Fluorochrome 이름을 클릭하시면
대응되는 형광필터의 조합을 확인 하실 수 있습니다.
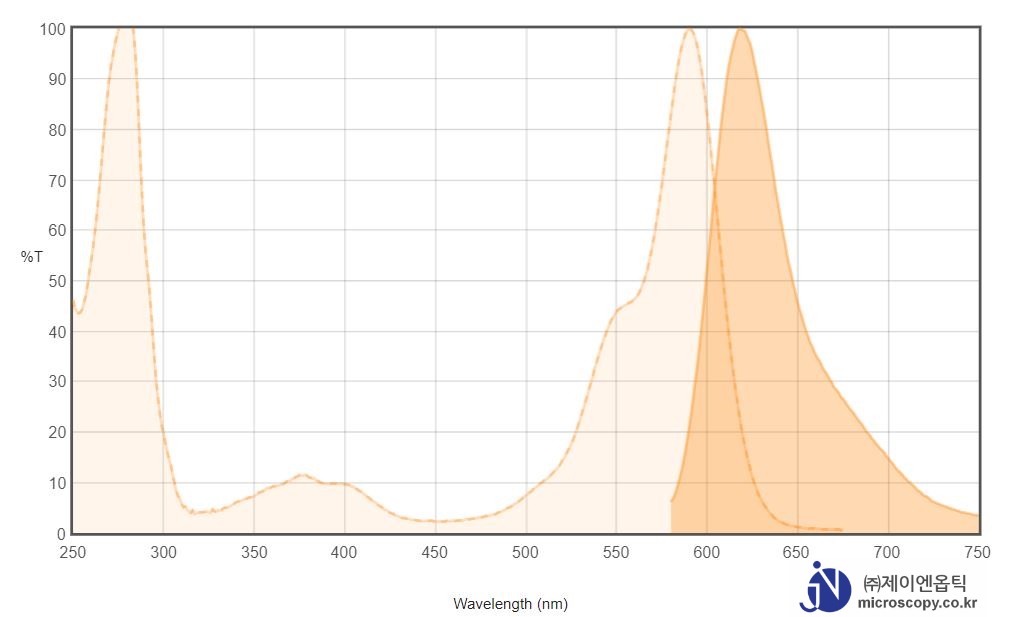
Alexa Fluor 594 dye is a bright, red-fluorescent dye that can be excited using the 561 nm or 594 nm laser lines. For stable signal generation in imaging and flow cytometry, Alexa Fluor 594 dye is pH-insensitive over a wide molar range.
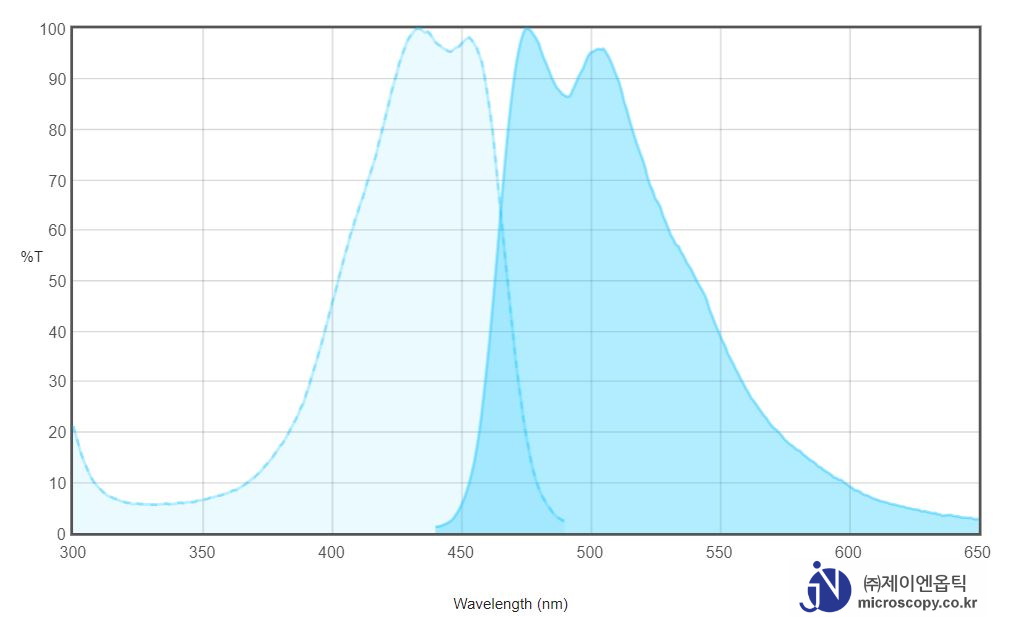
Cyan Fluorescent Protein (CFP) is a versatile biological marker for monitoring physiological processes, visualizing protein localization, and detecting transgenic expression in vivo. CFP can be excited by the 405 nm laser line and is optimally detected at 485 nm.
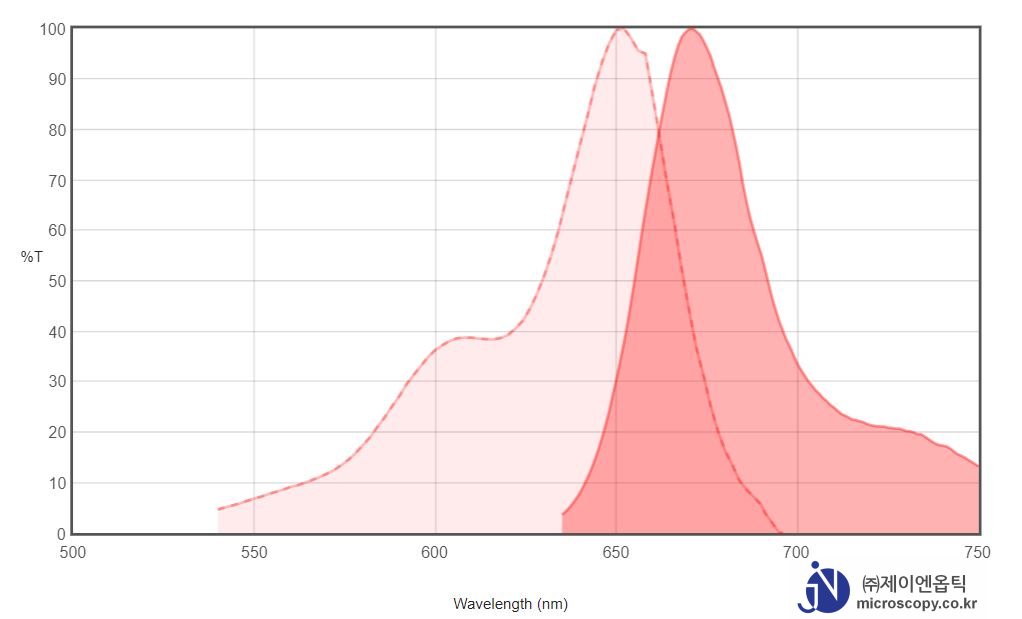
Cy5 dye is a bright, far-red-fluorescent dye that can be excited using the 633 or 647 nm laser lines, and visualized Cy5 filter sets. In addition to immunocytochemistry applications, Cy5 is also commonly used to label nucleic acids.
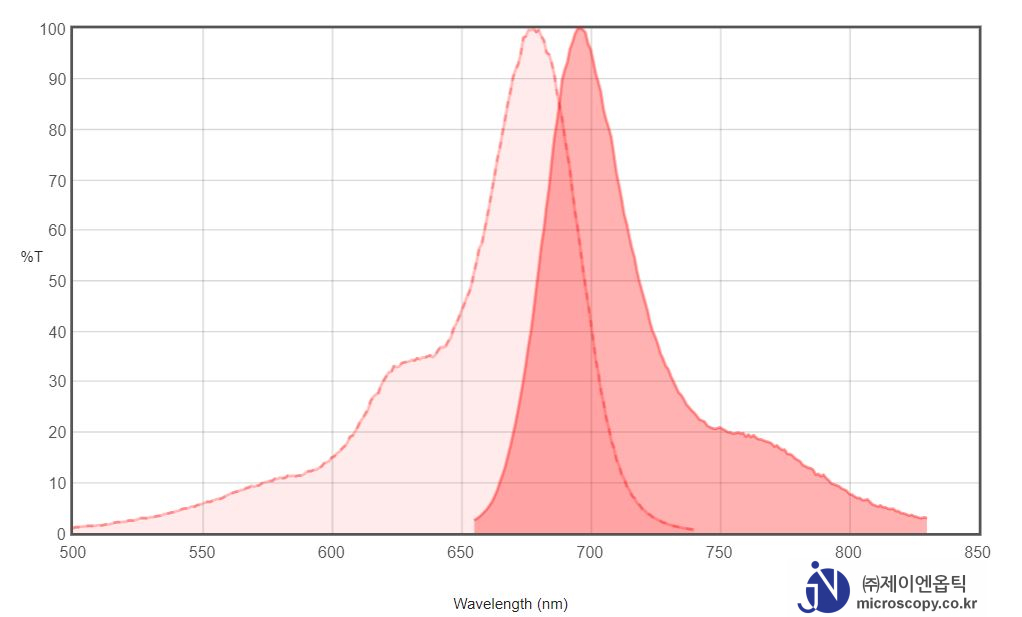
A variety of cyanine 5.5 (Cy5.5) dyes has been used to label biological molecules for fluorescence imaging and other fluorescence-based biochemical analysis. They are widely used for labeling peptides, proteins and oligos etc. Cy5.5 dyes are one type of the most common red fluorophores.
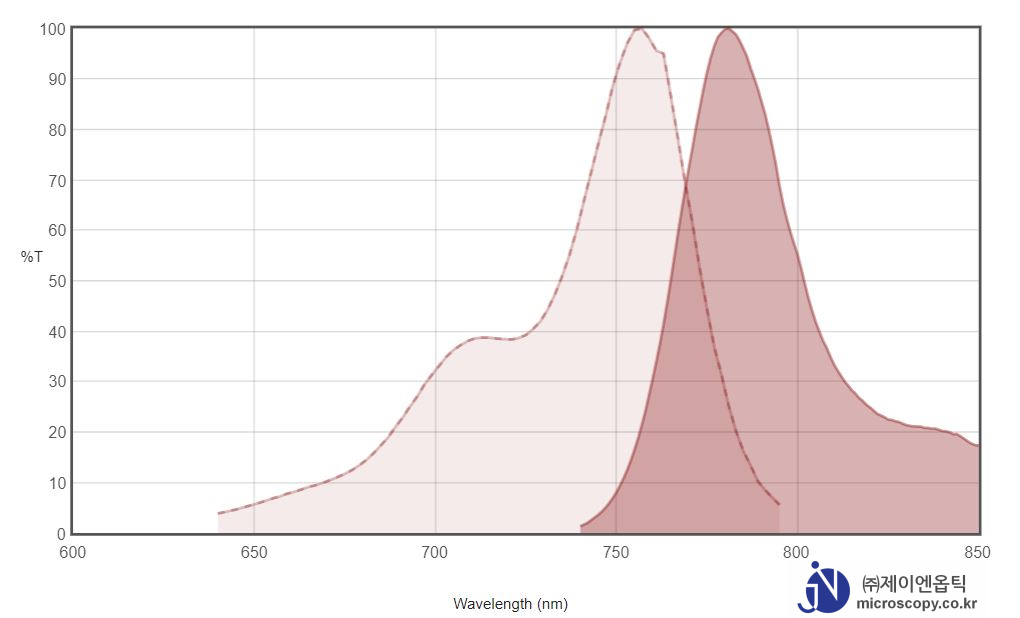
Cy7 is a near-IR fluor that is invisible to the naked eye (Excitation/emission maximum 750/776 nm). It is used in in vivo imaging applications, as well as the Cy7.5 dye.
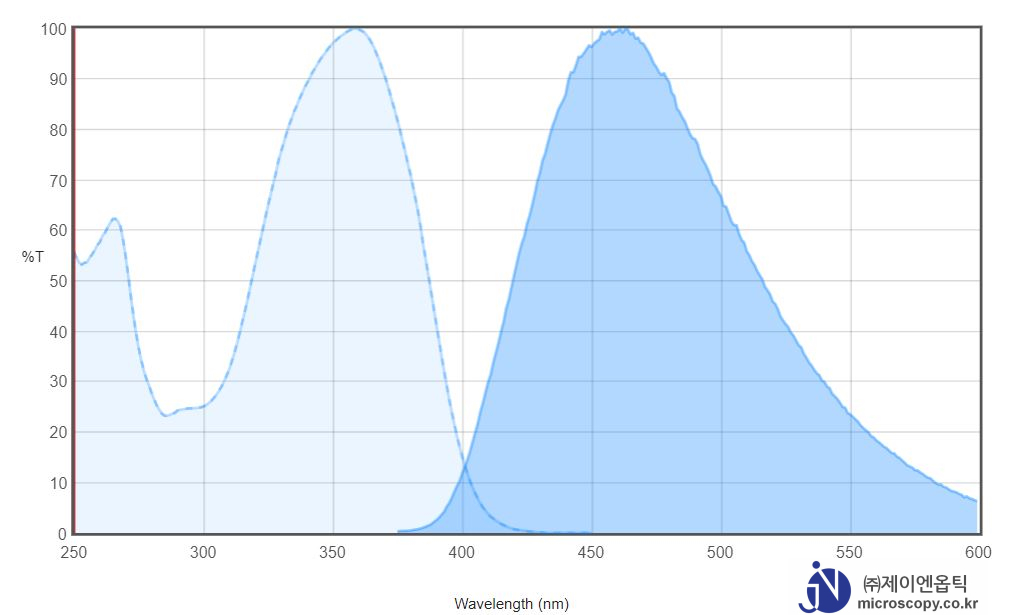
DAPI (4′,6-diamidino-2-phenylindole) is a fluorescent stain that binds strongly to A-T rich regions in DNA. It is used extensively in fluorescence microscopy. As DAPI can pass through an intact cell membrane, it can be used to stain both live and fixed cells, though it passes through the membrane less efficiently in live cells and therefore the effectiveness of the stain is lower.
Fluorescein isothiocyanate (FITC) is a derivative of fluorescein used in wide-ranging applications including flow cytometry. FITC is the original fluoresce in molecule functionalized with an isothiocyanate reactive group (-N=C=S), replacing a hydrogen atom on the bottom ring of the structure. This derivative is reactive towards nucleophiles including amine and sulfhydryl groups on proteins.

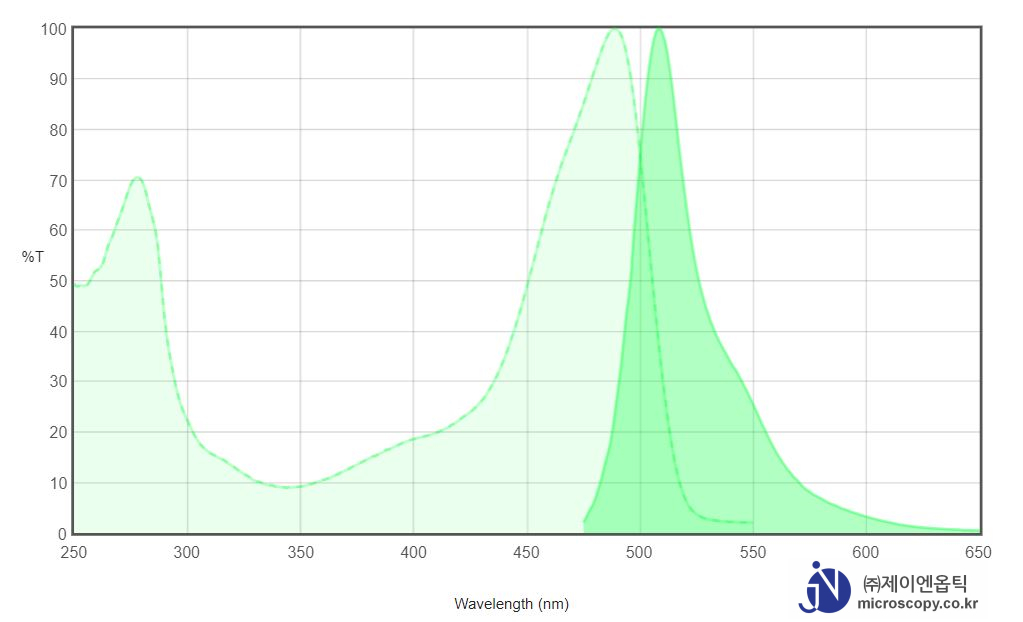
The green fluorescent protein (GFP) is a protein composed of 238 amino acid residues (26.9 kDa) that exhibits bright green fluorescence when exposed to light in the blue to ultraviolet range. Although many other marine organisms have similar green fluorescent proteins, GFP traditionally refers to the protein first isolated from the jellyfish Aequorea victoria. The GFP from A. victoria has a major excitation peak at a wavelength of 395 nm and a minor one at 475 nm. Its emission peak is at 509 nm, which is in the lower green portion of the visible spectrum.
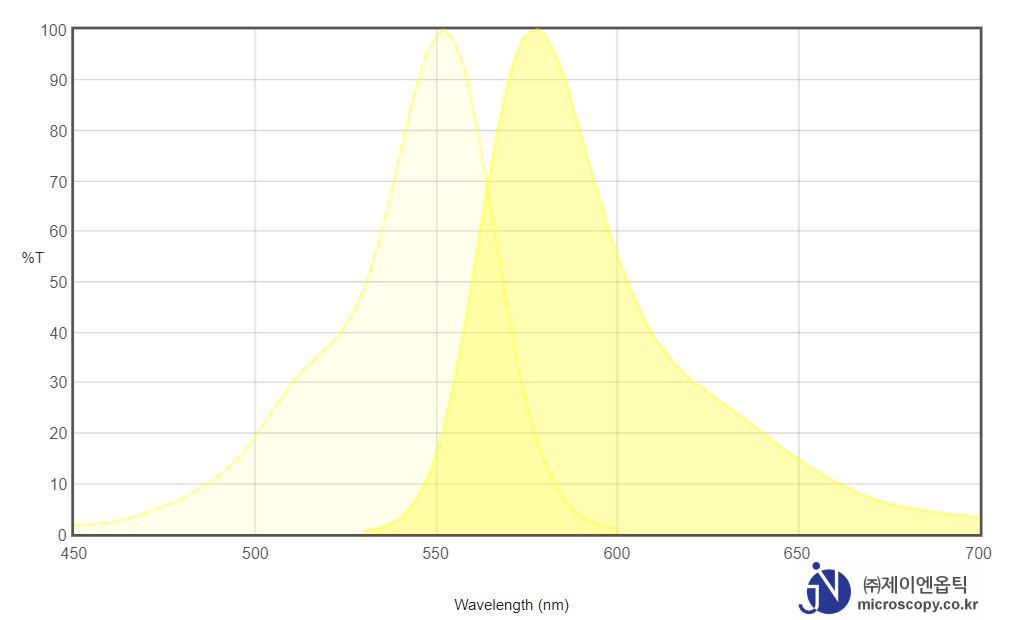
tdTomato is a genetic fusion of two copies of the dTomato gene (2) which was specifi cally designed for low aggregation (1). Its tandem dimer structure plays an important role in the exceptional brightness of tdTomato (Table I). Its excitation and emission maxima occur at 554 nm and 581 nm, respectively (1). Because tdTomato forms an intramolecular dimer, it behaves like a monomer, and has been used successfully for N- and C- terminal fusions. It shows excellent photostability and its half-time (t0.5) for maturation is one hour at 37°C.
Tetramethylrhodamine (TRITC) is a bright orange-fluorescent dye with excitation ideally suited to the 532 nm laser line. It is commonly conjugated to antibodies and proteins for cellular imaging applications.